
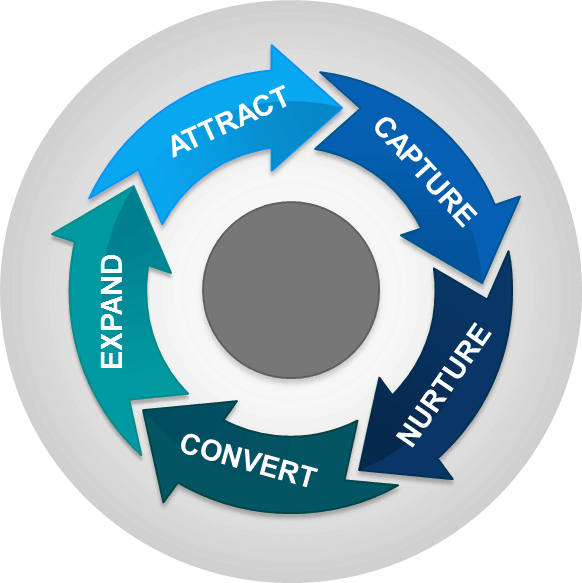
 This series looks at the five sequential stages in the B2B marketing lifecycle, and discusses the key metrics for each that can be used to gain key insights. In Part 1, we covered the first two stages: Attract and Capture. These are typically the stages that garner the most attention, as lead generation remains the most pressing concern at the typical company. In Part 2, we cover the stages of nurturing, converting to a sales-qualified lead, and post-sale retention and expansion, each of which contributes significantly to both costs and revenue.
III. Nurture
 At this stage, the marketing team builds a relationship with the prospect; the goal is to nurture them into a Marketing Qualified Lead (MQL) that is ready to be handed over to sales team. The length of this stage, and the content deployed, is dependent on the average length of the buying cycle, the complexity of the sale, the nature of your product, and the type of buyer(s) you have. For some companies, this stage may be 30 days; for others it can literally be a few years. The ability for a marketer to set up an automated program to manage nurturing at scale is a key argument for using a marketing automation platform. Such a program also helps you measure these activities, making it easier to determine results.
Some key questions at this stage are:
- Which automated programs are most effective in nurturing?
- Are there nurturing steps at which leads stall or drop out?
- Which activities are driving the lead scores up? Which show no effect?
- How many MQLs are created?
The metrics that matter include:
- Number of new leads: Prospects that are selected for active marketing. Your database should provide this information
- Number of reopened leads: These are older leads that had been labeled “not ready” (or something similar) and had been put into a drip program of some kind, which have recently demonstrated some kind of engagement that indicates growing interest
- Open rate, clickthrough rate of automated email programs: Open rates can be deceptive; as an example, if someone reads your email without enabling images, that read will not register as an open. Clickthrough rates are a better indicator of active engagement from an email recipient
- Lead score profile of new leads: This metric helps you observe lead quality over time. For this, identify all new leads opened in a month, and look at their lead scores at the end of the month. This could be a very valuable tool while communicating with sales reps (who tend to raise lead quality as an issue from time to time)
- Number of Marketing Qualified Leads (MQL): This is the target metric of nurturing programs; keeping track of it allows you to gauge effectiveness of nurturing programs. Note that it’s critical that sales and marketing together define the metrics that identify the MQL. If sales has input at this stage, it enhances their trust in lead quality and often results in better follow-up rates later
- Cost per MQL: The marketing program cost to create one MQL. This metric identifies the quantity-based cost efficiency of marketing programs, and is generated by dividing the program cost (which could include prorated labor and technology costs) by the number of leads generated. By itself, this metric can be misleading because it highlights marketing costs, but it gains more meaning later in the process when you can compare it to value generated
The bottom line at this stage is to generate more prospects ready to buy your product. If your lead generation and nurturing programs are improving, the percentage of leads that convert to MQL should increase also.
IV. Convert
 At this stage, all MQLs are screened and called on by sales. The goal is to convert them first to a Sales Qualified Lead (SQL) and then to a new customer. Marketing plays a vital secondary role, especially in creating mid-funnel and bottom-of-funnel communications that sales uses to convince the prospect that your product is the best suited for the prospect’s business needs. Examples of such communication might be an ROI calculator, or a chart showing how your product or service compares to the competition.
The key questions to be answered in this stage are:
- Which lead sources and campaigns are most effective in generating customers?
- How quickly are the leads converting?
- How many SQLs (“Opportunities”) are generated? How many new customers?
Some of the metrics that are helpful are:
- Number of SQLs: These are the number of leads that sales consider worthy of active pursuit based on several factors, including mutual fit
- Number of new customers
- Cost per SQL, Cost per new Customer: Marketing program costs rolled to these levels
- Campaign and Channel ROI: ROI can be calculated as 1-year sale value (bookings $) vs. marketing program costs. Here you might look at total costs, and also review ROI per channel and/or source
The bottom line at this stage is to generate more Sales Qualified Leads at a lower cost.
V. Expand
 As mentioned earlier, gaining a new customer is not the end of your marketing activities. The new customer should be marketed to, especially with educational content, so that customer has the most successful adoption of your product or service better and gain maximum benefit from it. This in turn will make the customer more loyal to your product. It is estimated that gaining a new customer is 6 to 7 times more expensive than retaining a customer. This statistic highlights the need to hold on to customers as a good business practice, as it’s the most practical way to maximize the return on your investment in a customer.
Retention and corresponding marginal income (the difference between sales and the variable costs of the product or service) is not the only benefit from marketing to existing customers. You can enhance the possibility of upsells and cross-sells of products and services which can bring substantial amounts to company’s coffers; and you can increase advocacy from customers who will happily refer new business and provide testimonials. Since referral business usually costs less to acquire, has a shorter selling cycle, and often leads to larger deals, it’s particularly cost-effective.
The key questions to be answered at this stage include:
- What customer marketing programs and campaigns are the most effective?
- How successful are we in retaining and upselling to customers?
- How is the customer loyalty trending?
The corresponding metrics include:
- Open and clickthrough rates of customer campaigns: Select the email campaigns (especially automated campaigns) that target current customers and track the vital statistics
- Churn rate: Number of customers lost in the period divided by customer count at beginning of the period
- Upsell $ as % of Total Sales $: This reflects a company’s ability to upsell to current customers. For new companies, this will be a small percentage (10% to 30%) while for seasoned companies it will become closer to 50% or more.
- A loyalty metric such as Net Promoter Score (NPS): NPS is an effective metric to show how customer loyalty is trending. In addition to an overall indicator, NPS provides verbatim answers that can indicate the key areas to invest in for increased customer loyalty
The bottom line at this stage is to limit churn and generate more revenue from existing customers.
Wrap-Up
We hope we’ve given you ideas about how you can create or improve a reporting framework that reflects the entire marketing lifecycle. The recommended next step is to select key metrics for each stage (from the list provided or similar metrics that you think are better fit for your business) and begin to track them on a regular basis. Monthly cadence is highly recommended because it gives you advance warnings within a particular quarter which could enable you take timely corrective steps.
How is the marketing lifecycle reporting relevant for your business? What are the ways it can be made more relevant? Please provide your thoughts in the comments section below.
Did you miss Key Considerations for Customer Lifecycle Marketing Reporting, Part 1, in which we discussed tracking and metrics for attracting and capturing leads? Read it here.